Recently Lending Club instituted a new policy concerning investor interactions with potential borrowers. Previously, investors could ask potential borrowers basically anything at all, and borrowers could respond at will. The new policy, presumably done to protect borrower privacy, restricts investor questions to a predetermined, limited, list.
Some investors are outraged. Why? Well, as Peter at Social Lending explained, some investors use Q&A to feel out potential borrowers. The goal of such careful vetting is to determine which borrowers are serious and which are likely to flake on the loan. Many investors used Q&A to explain the importance of Lending Club to investors, and to remind borrowers that investors at Lending Club are real people, not just a faceless bank. And it makes intuitive sense that a borrower that takes time to carefully describe their goals for a loan and detail their expenses will be a better bet than a borrower who acts disinterested or seems confused about their financial status.
So is there empirical evidence to support the idea that borrower descriptions of their loans matter? Lending Club loan data includes any description of the loan by the borrower. It looks like the data includes borrower responses to questions, but I am not certain about that. But there is enough data there for a rough analysis.
Comparing estimated percentage return for all loans, I can break out loans by the number of characters in the description. A very short description indicates that the borrower did not really engage with investor questions or did not try to “advertise” the loan by offering a thorough description of the loan purpose.
 Here is where things get interesting. Each circle represents a loan from the Lending Club data. Most loans result in a positive return on investment, so we see a cluster of loans at the top of this graph. But look at the clumping of loans along the left side. Loans that contain descriptions of less than, say, 1000 characters, are much more likely to show a negative return.
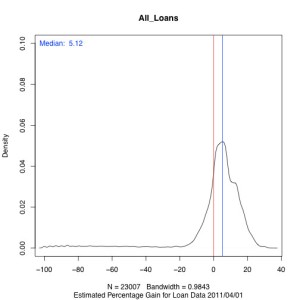
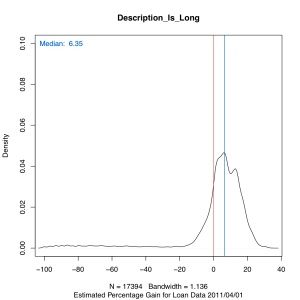
Another way to look at this is to take an arbitrary cutoff of characters. Say we reject all loans with less than 100 characters in the description and invest in all the rest. Is that return better, on average, than investing in all loans equally? The next two figures suggest that it is better to invest in loans with longer descriptions:
The effect is somewhat subtle, because we are dealing with thousands of loans. But the result is strong: a shift in investment return from 5.12% (median) for all loans to 6.35% (median) for loans with longer descriptions. In fact, this indicator—longer descriptions—is one of the strongest indicators I have identified thus far for choosing good loans.
This data tells me that loans with more thorough descriptions are better investments, on average, than loans with little or no description. By limiting Q&A, Lending Club is restricting the one tool that investors have to seek out quality borrowers.


Pingback: April was a Busy Month for P2P Lending Bloggers
I assume if I am reading your analysis correct, you state about the return is higher with longer comments. That’s true but the important aspect is the likely hood of default? It would be great if you could get the data on completed loans and get their loan description. Are they more likely to default with a short or no description?
Good idea. I will look into the data on just completed loans and try to do a follow-up.
IMHO the comments section was used for filtering or features missing from Lending Club’s service. If say for example they required an initial description it would much better help potential investors.
Hey, that’s pretty interesting, thanks sharing that! Is there any explanation for the bimodal distribution? Can you detail which dataset you used exactly and the date ranges for loans that were included?
Thanks!
I used the Lending Club In Funding data that I downloaded on the following dates: 1/29/2010, 8/1/2010, 10/5/2010, 11/3/2010, 12/1/2010, 1/1/2010, 2/1/2010, 3/1/2010 and 4/1/2010. I need multiple dates so I can see the transitions of loan status over time. The resulting date ranges for the loans are from the first loan issued (06/14/2007) through the most recent current loan (3/3/2011). I recognize that probability of default on a loan likely changed over that time period due to a host of factors (the recession, for one). But this is meant to be a relatively simple analysis.
I believe the slight bimodal distribution is due to the fact that some loans default (fairly quickly) while most tend to be paid on time until they are paid off. The result is, for any given loan, you either lose almost all your investment (thus the peak near -80%) or make a reasonable percentage on your investment (thus the more pronounced peak near 10%).
That seems like a valuable dataset that you’ve collected, I’m interested in looking into this further – would you mind sharing the data? I won’t share it further, and I realize that it’s an informal analysis.
Ignacio
readyforzero.com
Its pretty cool to see so many people discussing and showing their progress with Lending Club. I don’t have a ton of cash invested yet but my returns have been great. I’m still looking around the web, looking for posts showing people’s longterm returns.